Construction of a point cloud data set, true orthomosaic, and digital surface model using Pix4D
Lab Activity #11
Introduction-
Pix4D is a cutting edge software created to make true orthomosaics along with point clouds from images gathered by hand, by drone, or by plane. This software allows the user to create 2D and 3D models of the images they have recorded. Pix4D is based on finding thousands of common points between images. This software uses something called key points. Key points are points on two images that overlap and align. The higher the overlap, the more key points that the software will find making for a more detailed end product.
Before starting a new project it is important to understand how much overlap is needed when capturing images. In most cases one would like 75% frontal overlap with 60% side overlap. When it comes to dealing with sand/ snow or terrain that has little visual content, it is ideal to increase the overlap. This allows for images to maintain integrity while capturing the area of interest.
Pix4D can also process images taken from multiple flights, however it is important to keep a few things in mind. It is important to make sure that the plans capture the images with enough overlap, and that there is enough overlap between the two flight acquisition plans. One of the most important steps to remember is that you would like to try to capture images from the two different flights under similar conditions. It would be hard to process images and make for a sloppy final product if one captured images when it is sunny and 80 degrees out one day, then came back and captured images again when it is 35 degrees out and the rain is falling sideways.
Pix4D doesn't require one to use GCP's if they don't want to. Without GCP's the image would have no scale, orientation, and absolute position information. It is highly recommended that one uses GCP's when they have the option to.
One thing that is very important to pay attention to when creating a project in Pix4D is to always view the quality report. The quality report is automatically displayed after each step of processing. This report displays all kinds of metadata and information about the images being processed. It gives information on the quality of the images that were used, overall summary of the project, and even talks about the given number of geolocated images. It is always important to take a look at the quality report to see if everything processed correctly.
Methods/ Results-
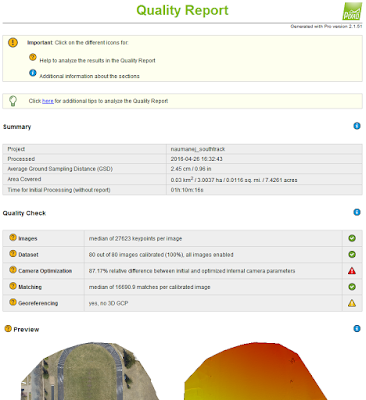
This was the first time the field methods class used Pix4D for processing imagery so everything seemed confusing at first. One small hiccup that was experienced was that this was new software that was updated and when processing images, it took forever. The first step to creating the imagery is to create a new project. This allows the user to name their project along with bringing in the images they have captured. The images that were uploaded at this point were provided for the class, but didn't include GCP's. Before starting to process the images, the class unchecked point cloud and DSM. We were only looking to run the initial processing. After the initial processing was completed, a quality report popped up on the screen. The quality report gave an overview of the images that were processed along with a preview of what the final product could look like (figure 1).
One thing that one wants to look at when going through the quality report is the number of geolocated images. Although there were no GCP's with the images, it did have a GPS on board. This allowed for 80 out of the 80 images to be geolocated (figure 2). It is important to keep the quality report from all of the processing that is done in Pix4D, that way one can always go back to see basically the metadata from the project.
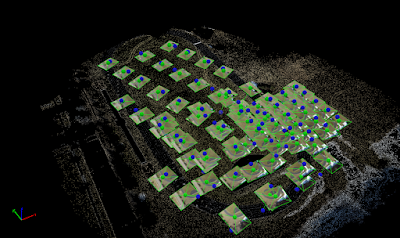
After the initial processing is complete, the next step was to finish running the images through the point cloud and the DSM. By unchecking the initial processing and turning on the DSM and point cloud, this allowed for the software to run faster by not rerunning the initial processing again. The process of running these images through the point cloud and DSM could take a couple of minutes to an agonizing couple of hours. After the DSM and point cloud were completed the class ended with a crazy looking image (figure 3).
Figure 3 shows the image that we gathered after completing these two processes. All the big green dots from figure 3 are the location of the images, while the blue dots are the geolocated points. To have this image make sense, by clicking triangle mesh on the left hand side, we gained a neat orthomosaic that makes sense to the eye (figure 4).
Now that we have gained our true orthomosaic, there were a few things that we were able to play around with. The class wanted to calculate the area of a surface within the Ray Cloud Editor, measure the length of a linear feature, calculate the volume of a 3D object, and create an animation that 'flys' through the project (figure 5/6).
 |
| Fig. 1 Small portion of the quality report and its summary |
 |
| Fig. 2 showing that 80 out of 80 images are geolocated |
 |
| Fig. 3 Images after DSM and Point Cloud processing |
 |
| Fig. 4 orthomosaic of the track and field using the triangle meshes |
 |
| Fig. 5 Finished map showing the volume of the building and the line distance |
 |
| Fig. 6 The fly view from the ray cloud in Pix4D |
Conclusion-
Upon completing this lab activity, the class could now reflect on the final product that was able to be created using Pix4D. Pix4D is an complex mapping software allowing one to create 2D and 3D imagery. Although this was the first time that this software was introduced to the class, there are many more features and disciplines that this software can do. The tools used in this lab activity only scratch the surface of what this software is capable of as it can open the door to much more advanced processing techniques. From mapping tunnels, to using GCP's, this software can open whole new categories for job opportunities and business reports.
Upon completing this lab activity, the class could now reflect on the final product that was able to be created using Pix4D. Pix4D is an complex mapping software allowing one to create 2D and 3D imagery. Although this was the first time that this software was introduced to the class, there are many more features and disciplines that this software can do. The tools used in this lab activity only scratch the surface of what this software is capable of as it can open the door to much more advanced processing techniques. From mapping tunnels, to using GCP's, this software can open whole new categories for job opportunities and business reports.
No comments:
Post a Comment